Electroencephalogram (EEG) studies the electrical activity of the brain produced by neurons firing in tandem via the scalp. EEG is particularly well-suited to studies that examine functional or effective connectivity and research where temporal resolution is important (da Silva, 2013). Intracranial electroencephalogram (iEEG), scalp-recorded EEG’s close relative, is an invasive technique usually performed in a clinical context. iEEG involves the surgical implantation of electrodes and is most often used for the mapping of epileptic foci (areas of focused seizure activity) prior to surgical interventions when epilepsy medications fail to work. Employed for decades in animal studies, human iEEG offers exciting new possibilities for examining cognition that cannot be observed in animal studies (Mukamel & Fried, 2012; Parvizi & Kastner, 2018).
One advantage of iEEG is that it permits direct recording of electrical activity at the individual cell or cellular cluster-level. Other modalities like PET and fMRI rely upon signals from the biproducts of neural activity such as the blood oxygen level dependent (BOLD) signal in fMRI, which is a metabolic response to neurological activity. Another advantage to iEEG is its extremely high spatial and temporal resolution, as well as its high signal to noise ratio (Mukamel & Fried, 2012). This can be seen in contrast to EEG, which has low spatial accuracy due to physiological barriers which are not present with iEEG. Studies using iEEG can provide data about neuronal activity on the millimeter scale in terms of localization and can capture temporal-related activity at the millisecond scale (Parvizi & Kastner, 2018). iEEG can also help us understand the nature of functional activity between different networks or regions of the brain and determine causality through neural electrical stimulation (ibid).
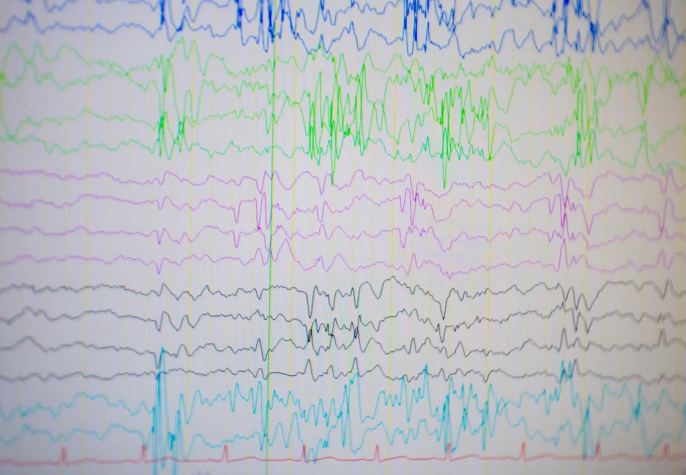
With both EEG and iEEG, fluctuations in the voltage of ionic currents produced by neurons are recorded through electrodes (St. Louis & Frey, 2016). Electrodes are the physical sensors or transducers that perform the analogue recording. They are connected to amplifiers, which not only amplify, but also filter the iEEG activity. iEEG data is represented by channels for each electrode, with voltages represented on the x-axis, and time represented on the y-axis. Event codes (which signal at what point periods of interest in an experiment occur) may be found at the bottom of the data graph along the y-axis (Acheson, 2019), depending upon the acquisition system used.
This guide will focus on data collection and management issues specific to iEEG and aims to be particularly useful to the new beginner. We additionally provide resources that can add additional depth as to the understanding of iEEG data, what iEEG records and iEEG analysis that go beyond the scope of this guide.