
Representation could be assessed by looking at the following: equality of representation, both in terms of the number of persons per MEP and the proportion of women representatives in the European Parliament (5.1); diligence of representatives, such as the participation of MEPs in EP votes, but also parliamentary activities other than voting, such as reports, opinions, questions, motions and debates (5.2); confidence in representation at the national level, including general public confidence in governments, parliaments and parties (5.3); and perception of being represented, that is, how far citizens feel that their voice counts at the European level, also as compared to the national level (5.4).
5.1 Equality of representation
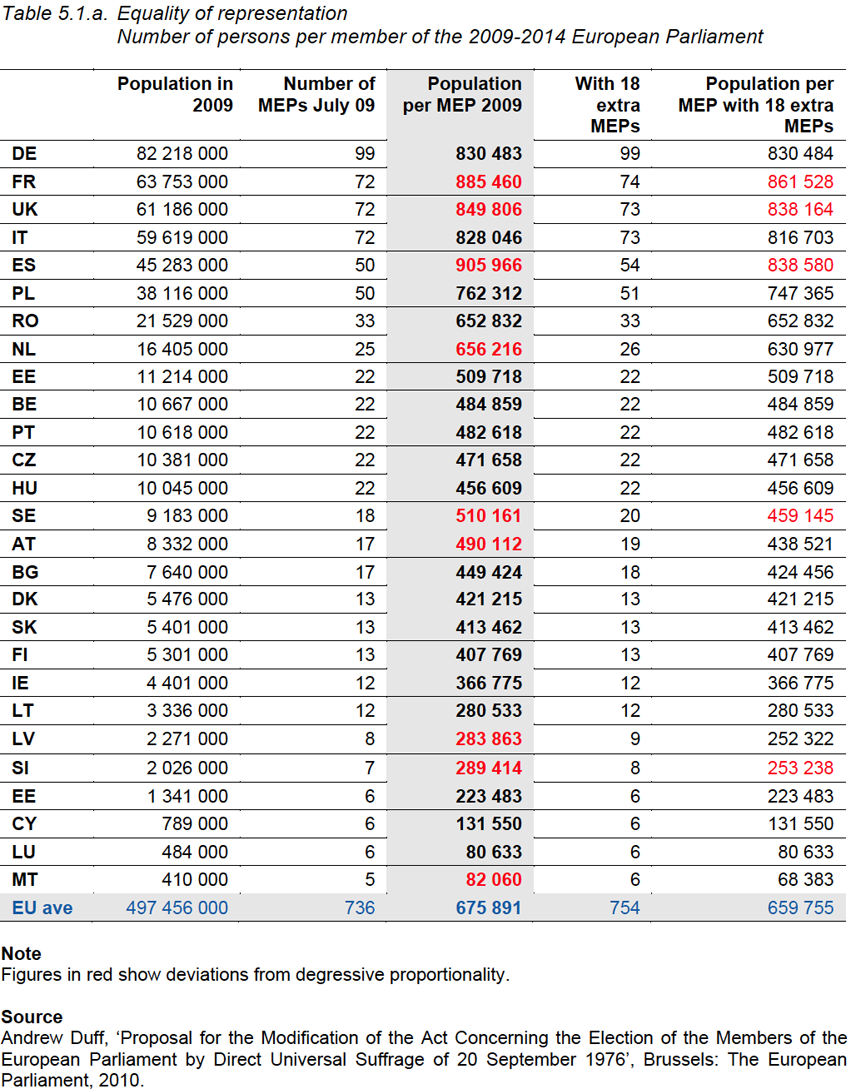
One person one vote is not enough to establish equality of representation. The number of representatives also needs to be allocated in an equal way. The obvious way of doing this is to aim to equalise the number of representatives per head of population. This, however, raises the following problem in the case of the European Parliament: assuming that a European Parliament of around 750 members is considered the maximum desirable size for a directly elected representative body at the European Union levels, it would only be possible to get close to an equal apportionment of seats to population by allocating just one MEP to the smallest member states.
When however they agreed arrangements for first direct elections to the European Parliament – and in subsequent rounds of treaty change – national governments took the view that a variety of different parties from each member state should be represented in the EP. Thus each member state has been allocated a minimum of six MEPs. The Lisbon Treaty now further stipulates that degressive proportionality should provide the principle for allocating further seats. Simply put, degressive proportionality means that the number of representatives per member state should rise with population, but at a declining rate as population rises.
The grey column of Table 5.1.a. shows the population per MEP in each member state. There plainly is significant deviation from strict equality in the number of representatives per head of population. The ratio between representatives and represented persons is up to 12 times higher in France than in Malta. However, present arrangements do not strictly conform to the principle of degressive proportionality. Where the latter applies, there should be no member state whose ratio of population to representation in the European Parliament is lower than another member state with a larger population. Yet the red figures in Table 5.1.a. show that the allocation of MEPs does not satisfy that test in the case of several member states.
Gender balance between representatives is another aspect of equality of representation. Not only may imbalances reflect inequalities of opportunities for women who seek a role as representatives. They may also make it less likely that matters of special concern to women will be fully represented in parliamentary deliberations and decisions.
Table 5.1.b. shows the proportion of women MEPs in each European Parliament since 1979. The gender balance between male and female MEPs have improved markedly since the first direct elections to the European Parliament in 1979. However, at 31 per cent, it remains well short of equality. Wide variations between member states – with just a handful approximating gender balance, whilst others still elected five times as many men as women in 2004 (Poland, the Czech Republic and Italy) – are probably attributable to national political parties who are responsible for candidate selection. However, they may also be an indicator of continuing differences across member states in cultural attitudes towards gender equality.

5.2 Diligence of representatives
There is much room for disagreement as to what amounts to good representation. However, doing nothing at all almost certainly constitutes bad representation. There are also certain core functions which representatives surely must perform if they are to count as representatives. Voting on legislation is, arguably, one such. Likewise, there may be some very good reasons why particular representatives do not do everything that a representative might conceivably do. However, it would be more alarming if a representative body as a whole did not so organise itself that its members cover all those representative activities in a division of labour between themselves.
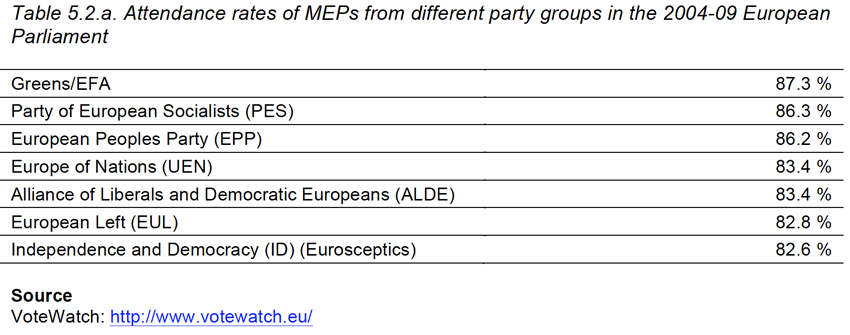
Table 5.2.a. shows the average participation of MEPs from different party groups in votes of the 2004-09 Parliament. There used to be significant differences in this regard with the core groups of the Parliament (EPP, PES, ALDE) participating much more often in votes than the peripheral groups. Table 5.2.b. shows that differences in how far MEPs from different member states participate in votes of the EP are likewise small.
Differences do, however, emerge when we look at other representative activities than voting. Table 5.2.c. shows how often MEPs from the largest national party delegations took part in (a) writing reports and opinions, (b) asking questions, (c) tabling motions, and (d) speaking in debates. The first and last of these items are arguably particularly significantly. Rapporteurs – or those who write reports – act as agenda-setters for the Parliament as a whole, i.e. they make a proposal for how the Parliament should use its powers. Participation in debate is, on the other hand, important for providing, and testing, alternative justifications for legislation.
These figures are compiled by national party delegations for two reasons. First, there are variations across those delegations. Second, national parties do the work of recruiting of MEPs with the skill and motivation to play the different representative roles.


5.3 Confidence in representation at the national level
The Lisbon Treaty claims that all citizens are represented twice over at the Union level: once through the directly elected European Parliament and a second time by the participation of their own elected governments in the European Council and the Council of Ministers. Lisbon also builds on a series of measures going back to the Amsterdam Treaty which aim at strengthening the link between national parliaments and the participation of their own governments in Union institutions.
It is therefore of interest to include a measure of general public confidence in national governments, parliaments and parties. Table 5.3. uses data from a recent Eurobarometer survey to do just that. The bottom line of the table shows that on average confidence in all three institutions is relatively low across the Union. The right hand column of the table shows that in some member states governments command more confidence than parliaments. In others, the converse is true. In general there are once again huge variations. For example national parliaments only enjoy the confidence of 6 per cent and 10 cent of the population in Latvia and Bulgaria, respectively. In Denmark and Luxembourg they have the confidence of 75 and 67 per cent of the public.

5.4 Perception of being represented
Given that there are so many different ideas of what constitutes good representation, it is hard to reach a definition of representation that is objective and measurable. It may therefore simply be easier to rely on subjective measures, or, in other words, to ask citizens whether they feel represented. They may well answer the question with hugely contrasting ideas of representation in mind, or even with none. Still, huge differences in how far people feel represented from one place, or time, or category of person to another are at least a prima facie indicator of unevenness in the quality of representation, whatever the variations in how representation is understood.
Eurobarometer asks respondents how far they feel that their voice counts in the European Union and how far it counts at national level, thus allowing for a comparison across member states of differences in how far citizens feel their voice counts at the two levels. Table 5.4.a. calculates the balance of those who replied that their voice does count over those who feel that it does not. Thus, for example, the first cell in the table shows that 21 per cent more of the respondents from Sweden replied that their voice does indeed count in the European Union than those who replied that it does not.
Perhaps three conclusions emerge from the table:
First, there are very large variations across member states. The balance of those feeling that their voice counts at the European Union level is +34 per cent in Denmark and -64 per cent in Latvia.
Second, on average people are more likely to feel that their voice counts at the national level than in the European Union. Those who feel that their voice does not count in the EU exceed those who feel that it does count by 15 per cent. In contrast, those who feel that their voice does in the national arena exceed those who feel that does not by 8 per cent.
Third, as shown in column 3 there are also large differences between member states in how far they feel they have more of a voice in the national arena than the European. There are even a handful of member states – Italy, Romania, Malta, Bulgaria, Greece, Hungary and Lithuania – where more respondents feel that their voice counts in the European Union than at national level.

As seen in the discussion of Table 5.4.a., Eurobarometer asks respondents how far they feel their voice counts in the European Union and at national level. As it happens there is a close relationship between the answers respondents give to the two questions. In other words those who feel that their voice counts at national level are also more likely to feel that their voice counts in the EU and vice versa. Table 5.4.b. illustrates the point graphically. If one compares one diagonal of the table with the other, there are 24 member states in the diagonal from top-left to bottom-right and only 3 member states in the other diagonal. In other words, it is true of almost all member states that, if individuals have an above average perception that their voice counts at one of the levels, they have an above average perception that it counts at the other. If they have a below average perception that it counts at one level, they have a below average perception that it counts at the other.
One possible reason for this close relationship is, of course, that national democratic institutions are just one possible channel of representation to the European level. If individuals feel that their voice does not count in shaping the views and behaviour of their own national parliaments or governments, then they are also likely to feel that one possible channel by which their opinions and needs could be relayed to the European level is blocked. As with much else – rights, parties, the administration of elections, the role of the media and so on – the Union remains dependent on the democratic institutions of its member states for its actual and perceived democratic performance in all kinds of ways.

The previous table demonstrated that there is a close relationship between those who feel that their voice counts at the national level and those who feel it counts at the national level. Another way to make the same point is simply to rank member states out of 27 in responses given to the two questions. Table 5.4.c. does just that. It shows that in 13 member states out of 27 there is only a difference of two places in how their citizens rank in their perceptions that their voice counts in the Union and at national level.

